ServiceNow increases workflow agility with new Quebec Script Tracer
A new platform feature of the ServiceNow Quebec release and something that I am very excited about is Script Tracer.
Script Tracer is a debugging tool that once activated will show you the ServiceNow scripts that are changing the record you are currently interacting with. Once Script Tracer has been started and a transaction processed, it will allow you to see any values that have changed on the record and which script has caused this change. It will show you in that same window the part of the script that has caused the change and from there you can quickly see the full script, or even move to the script debugger to analyze it further.
If you are like me and have had to come back to an area of ServiceNow that you have not seen for a while, or maybe you’ve been asked by a client to enhance an existing part of the tool, you might have found that something is changing a value on a record and you do not know why. This can be especially frustrating if it is not obvious why this is happening and is getting in the way of your new piece of work for a client!
Previously you might have started by analyzing what happens at the user experience side and using what you see to take a look further at different types of scripts. You perhaps would have gone straight into Business Rules for example and started looking there or watching the field to see if UI Transactions show any clues.
Or maybe you’ve activated the script debugger and recreated the scenario, sifting through the Business Rules that are running and then using Breakpoints and Logpoints to analyze specific scripts even further.
Maybe you’ve even run a code search in ServiceNow Studio for the field name, to try and find the script changing the value.
With Script Tracer you can shortcut a lot of this investigation now by doing the following:
- As an Admin, launch Script Tracer (System Diagnostics > Script Tracer)
- Perform the transaction that is causing the issue
- Review Script Tracer
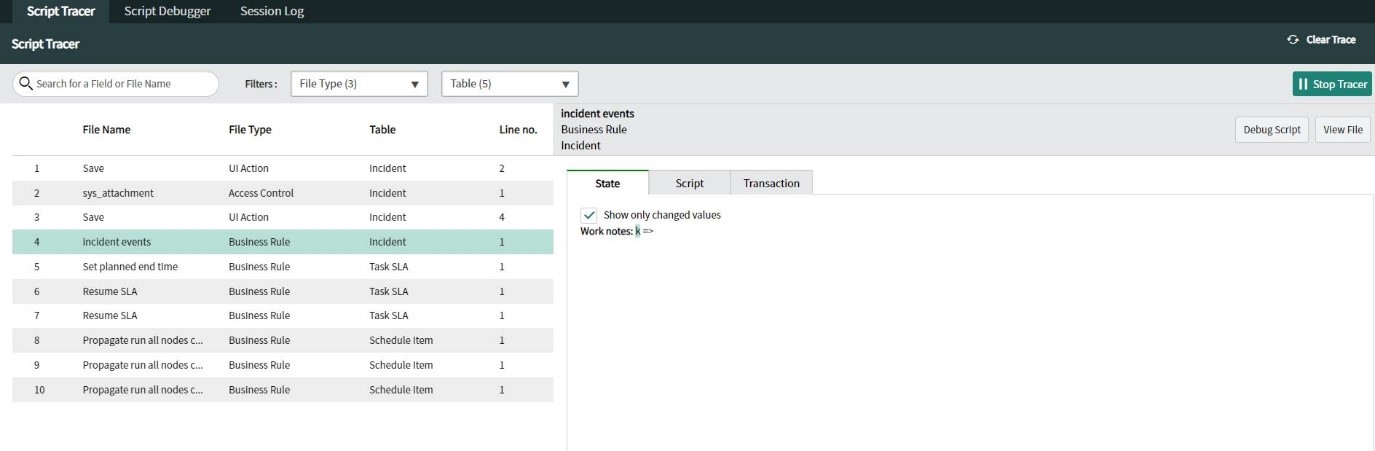
Script Tracer will open in a separate window, in the same window as Script Debugger and Session Log. You can see along the top of the screen you can easily click between them.
It displays in the main portion of the screen the scripts that have run during your transaction and will filter the script types so you can see what they are and quickly narrow them down (for example you might be sure it’s a business rule) and you can filter the table too if that is going to help.
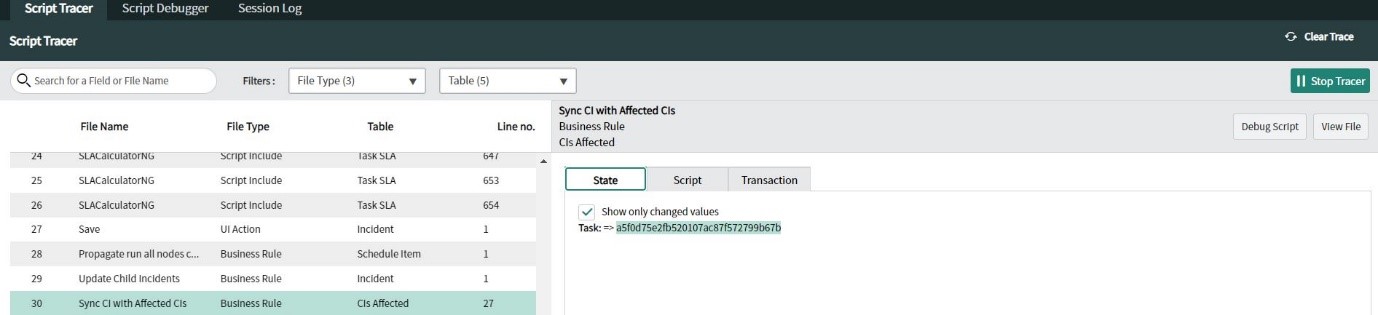
When you select an individual script, you can see on the right-hand side three tabs – State, Script, Transaction.
State – will show you the values changed, with an optional tick box to show you all the values on the record you are looking at
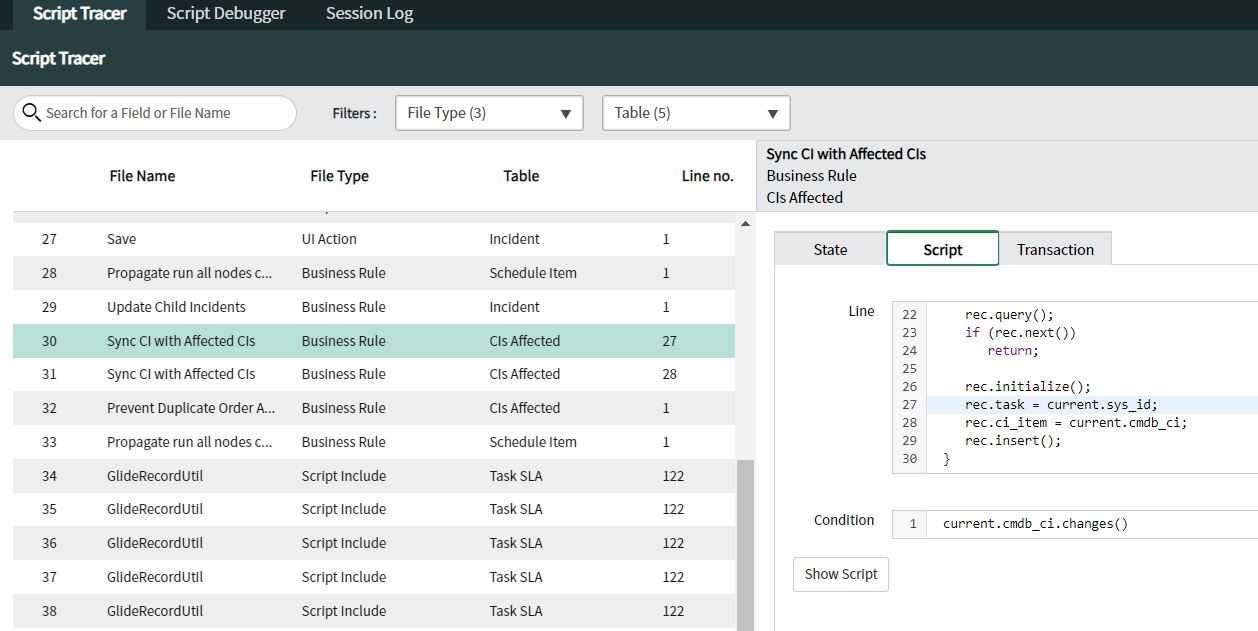
Script – will show you the actual script you are looking at, and specifically will jump to the line in the code that is changing the value. Optionally a “Show Script” button allows you to see the script in full
Transaction – will show you the transaction log for this activity.
Two further buttons appear on each script tab – Debug Script and View File
Debug Script – Brings the script into the script debugger tab, which means you can immediately then start adding Breakpoints and Logpoints to interrogate the script further. Great for deeper investigation into why something might be happening.
View File – Brings you back to the platform view of the script, so you can edit it if required.
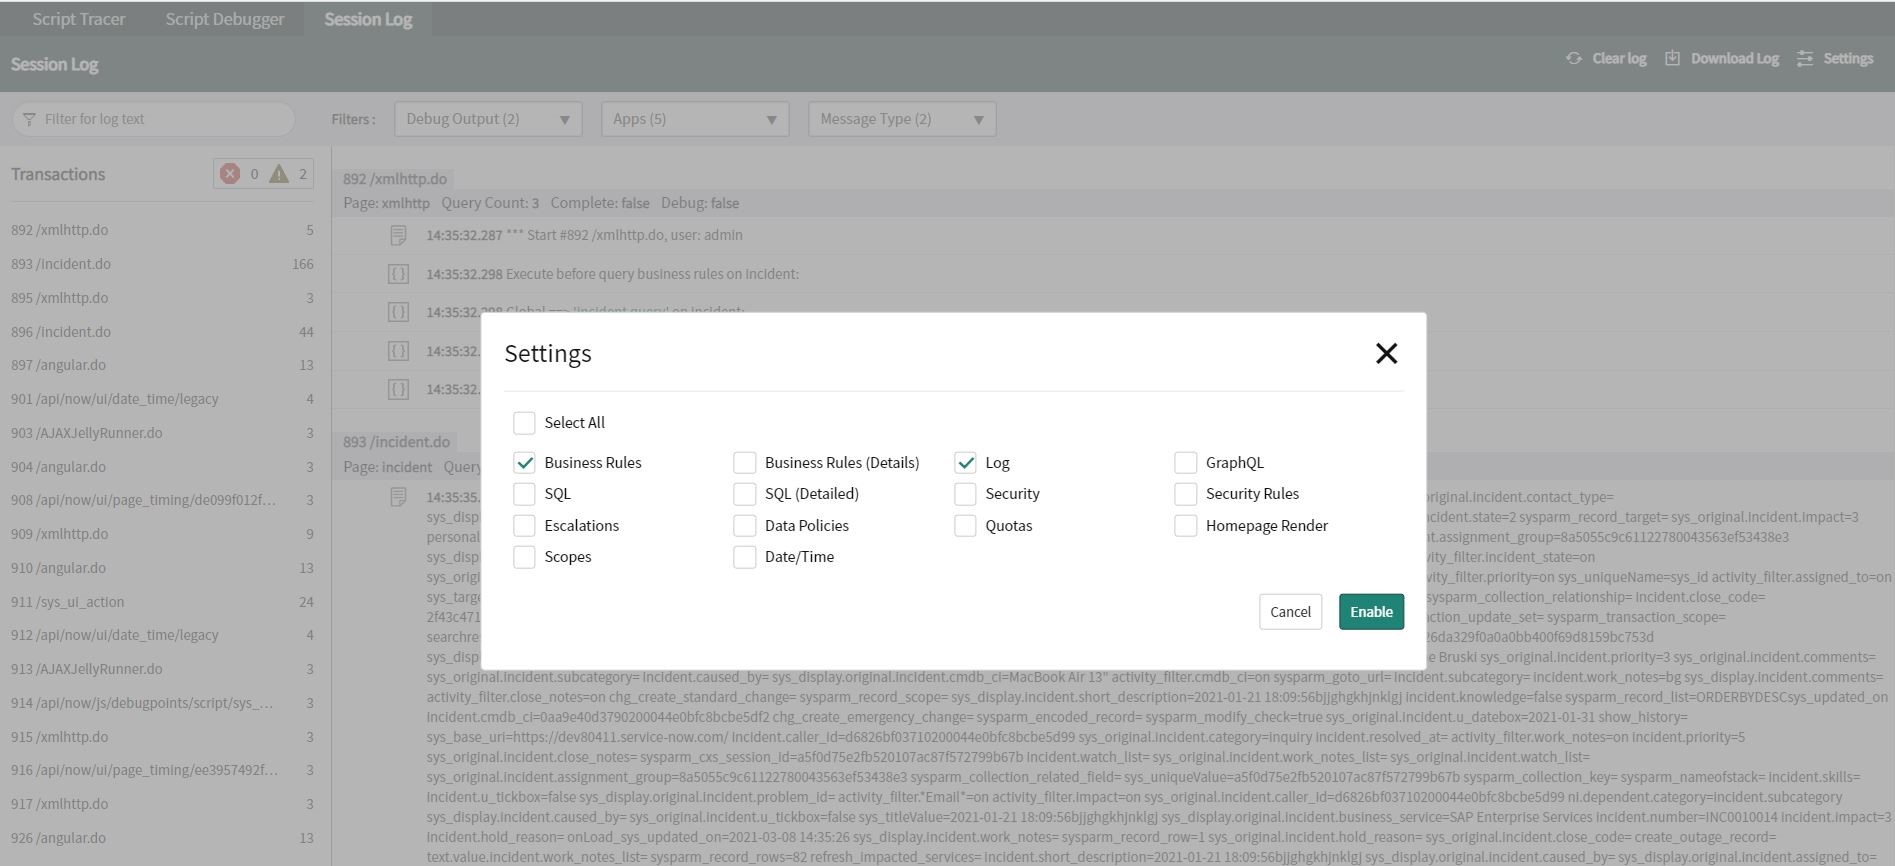
Finally, although not technically part of Script Tracer, it is worth mentioning that in the Session Log tab you can easily get to the Settings which controls the debug settings and turn these on or off.
This means you can quickly see, activate or de-activate the various debug settings across the instance – all without leaving the debug window. This is an alternative to going via the platform Session Debug and individual debugging options and allows you to easily see which debug options you currently have active.
There are a few limitations with Script Tracer to be aware of. The number of scripts that it will trace is by default 1000, but you can clear the current trace manually at any point, and even edit the default by changing the system property glide.debug.trace.trace_line_limit. Also, Script Tracer works predominantly with server-side code, so it won’t show you Client Scripts or UI Policies that are running, although it will show UI Actions.
Overall, I will be very excited to get my hands on Script Tracer in Quebec and put it through its paces. I suspect it will enhance my troubleshooting and development activities in ServiceNow as I’ll be able to quickly see which scripts in the platform are causing things to happen, and having Script Tracer, Script Debugger and the Session Log in one pane of glass will make it much easier to work with and speed up my day-day work in ServiceNow.
For more information on Script Tracer, take a look at the official ServiceNow documentation, or to see it working live take a look at this ServiceNow Creator Toolbox session.
Keep an eye on our blog posts as we continue to spotlight other Quebec functionalities and deep dive into some of the new release capabilities. Our next blog from the Quebec series will explore the Quebec Release Universal Request.
- Contact us:
- 0800 783 3040
- info@engage-esm.com